Prioritize Qualitative Research Insights with the Opportunity Gap Survey
How this survey can help your team determine insight impact
👋 Hey, Nikki here! Welcome to this month’s ✨ free article ✨ of User Research Academy. Three times a month, I share an article with super concrete tips and examples on user research methods, approaches, careers, or situations.
If you want to see everything I post, subscribe below!
I remember the first time I ran a very successful generative research study. I had spent months practicing my skills and finally felt like I had achieved a rhythm and depth that got us deep and meaningful data from our participants.
I had uncovered information beyond what we had imagined. Not only did I answer the study's goals, but the data we received included innovative, never-before-heard insights that surprised us. The “wows” we said topped those of Owen Wilson.
Never had I gathered quite as much qualitative research and so many insights. At the end of the study, I had to bring my report down from over fifty pages to something more manageable, but I had no idea which insights to prioritize.
Of course, I started with the study goals and made sure I shared the information the team needed to move forward with the decisions they’d been struggling with. But I had so much more deep data and interesting information for them.
Since I hadn’t had this kind of “problem” before, I wasn’t sure what to do, so I roped my entire team into the process of understanding all the insights and trying to decide which ones we should focus on first. While I was thrilled that the study had such an impact and gave us so much data, I soon saw how this could be a substantial problem. Outside of the direct insights we needed for the study goals, we had a very hard time trying to determine what else to focus on from the learnings.
After three workshops of trying to prioritize the insights, I threw my hands in the air, frustrated by our lack of progress. We had gone around in circles trying to determine which of the fifty insights were now, next, and later. We’d tried various prioritization models, such as RICE (Reach, Impact, Confidence, and Effort) and the Kano Model, but none of them seemed to help. We walked out with questions and doubts.
When that last workshop ended, instead of scheduling another, I decided to take a step back. We had put so much effort into this study and got everything we asked for and more, but now it felt like it was all being wasted. I could predict that, soon, people would give up on this exercise, and the insights would be stuck somewhere in a Google Drive folder like I’d seen happen before.
I researched how I could potentially solve this prioritization problem and stumbled across something called the Opportunity Gap Survey.
What is the Opportunity Gap Survey?
Officially, the opportunity gap survey is part of the Jobs to be Done framework and the Opportunity-Driven Innovation framework created by Anthony W. Ulwick. However, when I found out about this opportunity survey, despite not using Jobs to be Done for this study, I thought I could possibly use it to help us make some decisions.
The opportunity gap survey analyzes the gap between how important each insight is and how satisfied people are with current solutions. The “gap” between the perceived importance and the perceived level of satisfaction is your opportunity score. The bigger the gap between how important something is to the person and how satisfied they currently are, the bigger the potential opportunity.
Let’s look at an example to make this more concrete.
Imagine we were doing a study on students going through medical school — I asked my best friend about this since she went through this process a few years ago. We’re trying to understand their different needs during the process of “surviving” medical school.
During this generative study, we uncover the following needs and goals of medical students:
Pass STEP exams
Find research and paper publication opportunities
Discover a mentor
Find cheap accommodation
Study for in-person interactions with patients
Find time for exercising
Overcome impostor syndrome
There is quite a lot of variety within these learnings, so where do we place our focus, and where do we start?
This situation is when the opportunity gap survey can become a very handy tool. For each of these points, we’d create two questions, one focused on the level of importance and the other on the current satisfaction. These questions each follow the below model:
How important is it to you that you are able to [outcome/goal/need]?
1 to 5 scale, 1 = “Not at all important”, 5 = “Extremely important”
When using [current solution], how satisfied are you with your ability to achieve [outcome/goal/need]?
1 to 5 scale, 1 = “Not at all satisfied”, 5 = “Extremely satisfied”
So, for each of the above points, we’d fill in the goal, need, or outcome, for the two questions, and it would look like this:
How important is it to you that you are able to pass the STEP exam?
1 to 5 scale, 1 = “Not at all important”, 5 = “Extremely important”
When using your current solution, how satisfied are you with your ability to pass the STEP exam?
1 to 5 scale, 1 = “Not at all satisfied”, 5 = “Extremely satisfied”
You’d set up these two questions for each of the bullet points above.
It might be that you’ve uncovered the solutions participants are using, so you can specify in the question if that’s the case, or you can even ask about the satisfaction of your own product as a solution (if the participants are users).
Once you send this out, you will start to receive opportunity scores, the delta between importance and satisfaction, which will help you to prioritize your learnings. We’ll cover analyzing the score in a second, but first, let’s walk through what creating an opportunity gap survey looks like.
How to Create an Opportunity Gap Survey
The entire point of this survey is to help you prioritize findings and insights from generative research, so the first and most essential step of creating an opportunity gap survey is to conduct some generative research. Basing your survey on results from this type of research is critical to ensuring you get the most accurate information from your participants.
Setting Up Your Study
Whenever I know I’m going to use a generative research approach, I automatically assume that I will be sending out the opportunity gap survey at the end of the study to help us prioritize insights and needs. By knowing I will send out this survey, I can ensure I get the most relevant information from participants, setting us up for success.
The first step to a successful study is setting up a research plan with incredibly clear research goals.
Research goals are the in-depth areas we want to explore in our research project that will help us answer what we are trying to learn. These goals are the things we want to be able to gather information about by the end of the study. They aren’t posed as questions, but we want to be able to “answer” them in the sense of getting enough data on them to feel comfortable making decisions.
When it comes to a generative research study that has an opportunity gap survey, my goals usually consist of:
Discover the unmet needs of our participants and where we don’t support them in [topic]
Identify participant’s goals and their current process to achieve those goals
Uncover the different tools participants are currently using to achieve their goals and what their experience is like with them
Through this study, I am hugely focused on goals and needs, which is the exact information I need to put together an opportunity gap survey.
The opportunity gap survey will only be as helpful as it is relevant to the information you get. If you don’t have information on goals and needs, the opportunity score won’t be as helpful in prioritizing what you focus on. As always, make sure the approach makes sense given the goals of your study and the information you collect from participants.
Creating the Survey Questions
As covered above, for each need, goal, or outcome you uncover, you use both the importance and satisfaction questions to get the opportunity score:
How important is it to you that you are able to [outcome/goal/need]?
1 to 5 scale, 1 = “Not at all important”, 5 = “Extremely important”
When using [current solution], how satisfied are you with your ability to achieve [outcome/goal/need]?
1 to 5 scale, 1 = “Not at all satisfied”, 5 = “Extremely satisfied”
Let’s look at a few more examples of putting these together.
Need: Keep track of my eating habits
How important is it to you that you are able to keep track of your eating habits?
1 to 5 scale, 1 = “Not at all important”, 5 = “Extremely important”
When using MyFitnessPal, how satisfied are you with your ability to keep track of your eating habits?
1 to 5 scale, 1 = “Not at all satisfied”, 5 = “Extremely satisfied”
Need: Minimize time inputting expenses
How important is it to you that you are able to minimize your time inputting expenses?
1 to 5 scale, 1 = “Not at all important”, 5 = “Extremely important”
When using Xero, how satisfied are you with your ability to minimize your time inputting expenses?
1 to 5 scale, 1 = “Not at all satisfied”, 5 = “Extremely satisfied”
Need: Give specific package delivery instructions
How important is it to you that you are able to give specific package delivery instructions?
1 to 5 scale, 1 = “Not at all important”, 5 = “Extremely important”
When using UPS, how satisfied are you with your ability to give specific package delivery instructions?
1 to 5 scale, 1 = “Not at all satisfied”, 5 = “Extremely satisfied”
Need: Minimize the time it takes to research where to stay on a trip
How important is it to you that you are able to minimize the time it takes to research where to stay on a trip?
1 to 5 scale, 1 = “Not at all important”, 5 = “Extremely important”
When using Expedia, how satisfied are you with your ability to minimize the time it takes to research where to stay on a trip?
1 to 5 scale, 1 = “Not at all satisfied”, 5 = “Extremely satisfied”
As you can see, this survey is extremely adaptable and, as long as you have the right information to put into it, can be relatively simple to put together.
Whenever it comes to surveys, however, always make sure you take into consideration the number of questions. Since, essentially, each need is two questions, these can add up very quickly. Typically, once a survey response time exceeds seven minutes, you may start to see a significant drop-off in responses.
I like to keep my surveys shorter, — around fifteen questions (I count each of the two questions as one in the case of the opportunity gap survey — which might mean you can’t include all of your needs in your opportunity gap survey. In studies where I’ve had more than fifteen needs, goals, or outcomes to prioritize, I’ve had to sit with my team and try to work out the ones that are most important to ask in our given context.
Another option is to send out several surveys in different phases. Obviously, this takes longer, but it can be a good compromise. You still need to prioritize which questions you’re sending out first.
For this, we typically use the RICE model to help us understand which are the most important questions to send. Another way I’ve prioritized the questions is by the weight of the need, goal, or outcome. What I mean by this is how often that need, goal, or outcome came up across participants. The more participants who mentioned the given need, goal, or outcome, the higher it went on the list of questions.
Sending the Survey
Once you have your questions set, it’s time to send out your survey. This part prompted some questions, such as, “Who should I send the survey to?” and “How many people should I send it to?”
Typically, with generative research, you have a smaller sample size, such as fifteen or twenty participants. Unfortunately, that number is a bit too small of a sample size for a survey, and limiting to only that group of users may skew your results.
Ideally, when it comes to this type of survey, you would send it out to similar participants to those you interviewed, whether this means a particular persona, segment, or demographic. Make sure the survey participants are similar to those you interviewed and would have the same needs, goals, or outcomes, or use the same solutions. If you aren’t sure whether they’ve used those solutions or not, make the satisfaction question more generic by saying “your current solution.”
For this particular survey, we aren’t looking at comparison, so we can use a confidence interval around sample means, which in this case, are average satisfaction and average importance. So, we must determine our comfortable margin of error and confidence interval.
The most common of these is a 5% margin of error and 95% confidence interval. Calculate your necessary sample size by understanding your population size and popping that into a calculator like this one.
Once you have all of that set, plug your survey into the many survey-based tools and send it out to more people than necessary in your sample size. Remember, not everyone will respond to your survey. Typically, you can expect a 10% - 20% response rate, unless you have a very engaged customer base, in which you can expect closer to a 50% - 60% response rate.
If you are new to surveys, the best thing you can do is test out your response rates and which medium (e.g. email, pop-up) gives you the best response. It might take some time to understand your numbers, but it’s great to experiment and iterate on this process!
Also, as a tip, always send a dry run of your survey internally to make sure there are no problems with it and to see approximately how long it will take, as one of the worst feelings in the world is to have to resend a survey because of an error. Trust me, I’ve been there.
How to Analyze Your Opportunity Gap Survey
Once you receive your responses, it’s time to analyze your survey. In general, the criteria are relatively straightforward. Any insight with a high importance and low satisfaction is a potential opportunity that will bring a high ROI. This score indicates people find the goal, need, or outcome important but are currently dissatisfied with the solution. So, if the team were to make a better solution that addresses that need, goal, or outcome, the higher likelihood the person would use it and be more satisfied.
The other scores include:
Low importance and high satisfaction
High importance and high satisfaction
Low importance and low satisfaction
These insights become deprioritized because there is either already a satisfactory solution or the insight isn’t important for users.
To score the test, you can use the following formula:
Importance + (importance - satisfaction) = opportunity
So let’s go back to one of our examples:
Need: Minimize the time it takes to research where to stay on a trip
How important is it to you that you are able to minimize the time it takes to research where to stay on a trip?
1 to 5 scale, 1 = “Not at all important”, 5 = “Extremely important”
When using Expedia, how satisfied are you with your ability to minimize the time it takes to research where to stay on a trip?
1 to 5 scale, 1 = “Not at all satisfied”, 5 = “Extremely satisfied”
Let’s say that a participant responded with the following data:
Level of importance is 4
Level of satisfaction is 2
We would then have:
4 + (4 - 2) = 6
The highest opportunity score for the survey is 9 (an importance level of 5 and a satisfaction level of 1), so an opportunity score of 6 is fairly significant.
Now let’s look at a different example.
Need: Give specific package delivery instructions
How important is it to you that you are able to give specific package delivery instructions?
1 to 5 scale, 1 = “Not at all important”, 5 = “Extremely important”
When using UPS, how satisfied are you with your ability to give specific package delivery instructions?
1 to 5 scale, 1 = “Not at all satisfied”, 5 = “Extremely satisfied”
Let’s say that a participant responded with the following data:
Level of importance is 2
Level of satisfaction is 4
We would then have:
2 + (2 - 4) = 0
Compared to 6, this is not a great opportunity to focus on. The participant does not find this insight important and is satisfied with their current solution.
For me, this has always been a relatively manual process since each participant has several scores (one for each insight).
Once you have scored each participant’s responses, it’s time to take the average opportunity score. To make this easy (using small numbers), let’s say we had five respondents to the insight of minimizing the time it takes to research where to stay on a trip. We got the following opportunity scores from the five participants:
6
5
7
8
6
We would then take the average of these scores and get an opportunity score for this insight of 6.4. We would do this for each insight so we understood the average opportunity score across all participants.
As I said, I’ve done this fairly manually on a spreadsheet (not the most fun), but there are some templates out there like this one, but they have slightly different setups to what I’ve used in the past.
How I’ve Used the Opportunity Gap Survey
I’ve used the opportunity gap survey quite a few times in my work to help with prioritizing qualitative research insights, especially when we were overwhelmed with the amount of information and no other prioritization model helped us.
An example
We had just finished an extensive project, with 25 diary study participants answering daily questions and then quite a few follow-up interviews to clarify some of the data. When I looked at our Miro board, I cringed at the amount of information on it. Everything was supremely interesting, and a lot of information was new. We’d looked at a new segment and how they found inspiration in fashion.
Since we’d rarely spoken to this segment in the past, we uncovered insights we’d never imagined, but, again, the team felt stuck. We had information and no idea how we could begin to prioritize what was most important to our customers, especially since we still didn’t know them well enough.
We had about thirty insights, which were too many to put into the opportunity gap survey. To narrow down which we would use, I facilitated a prioritization workshop. In that workshop, we went through all the insights, and we assigned a weight to each of them. That weight was based on how many participants had mentioned the given insight.
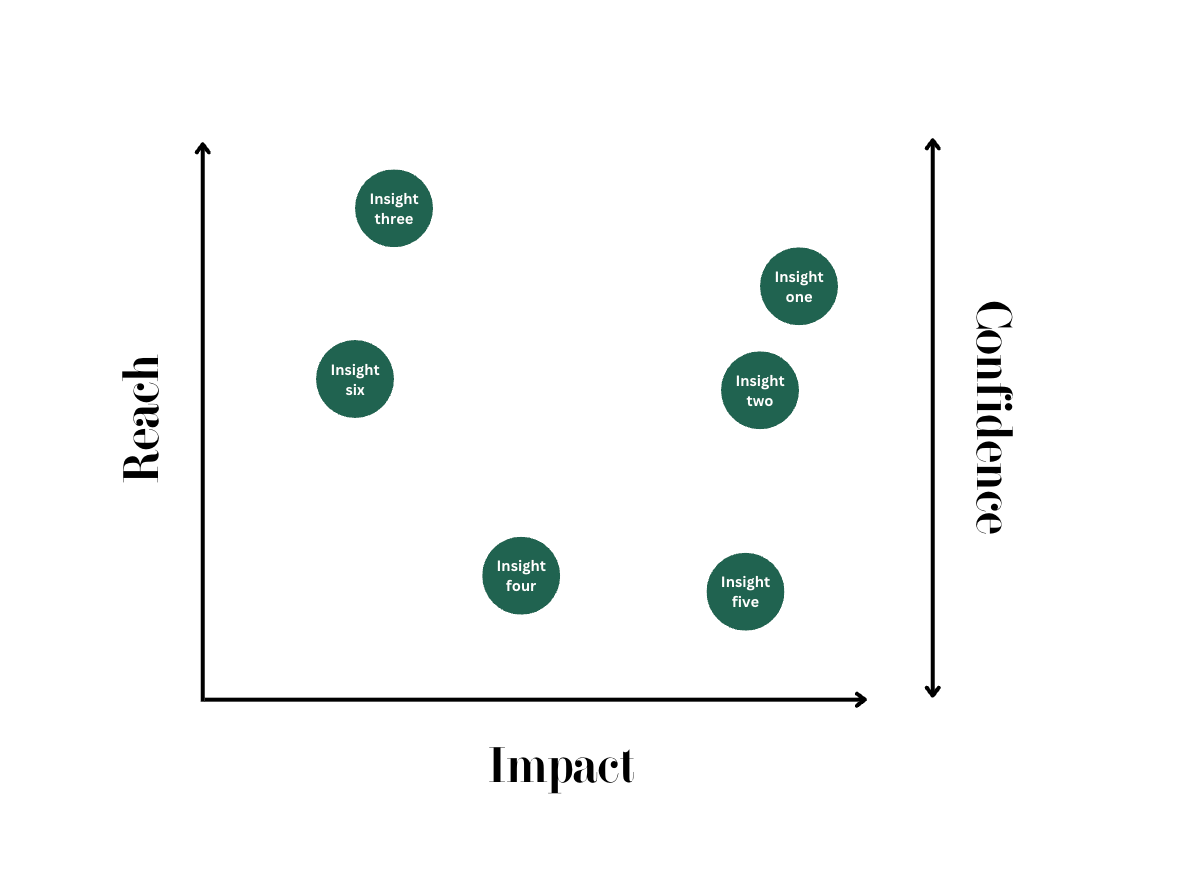
Once we’d weighed all the insights, we used part of the RICE prioritization model to predict our perceived reach, impact, and confidence of each of the insights. We left off the effort piece because there was no solution to base an effort level on. We used the weight of each insight to predict our confidence in it. In the workshop, we went through each insight and plotted it on an RIC matrix.
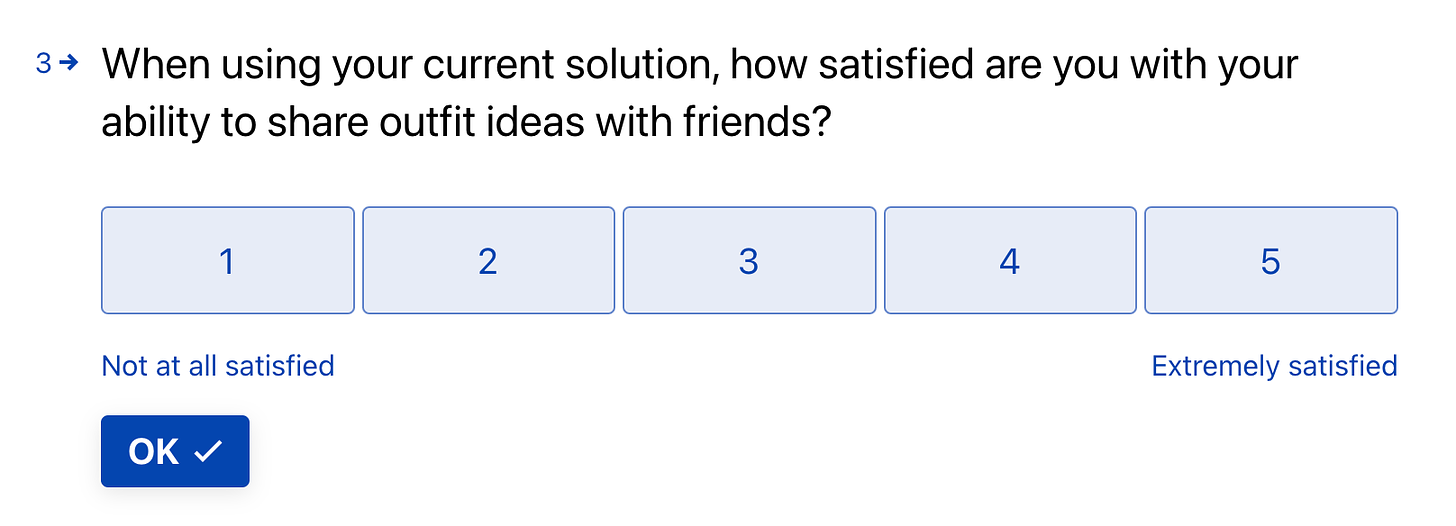
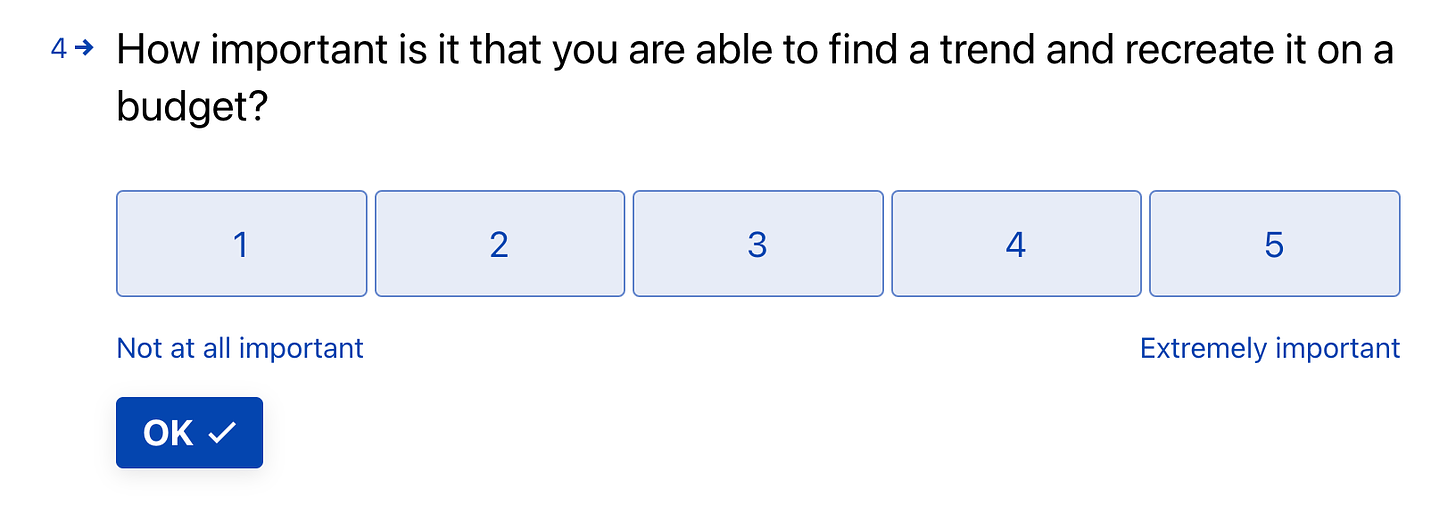
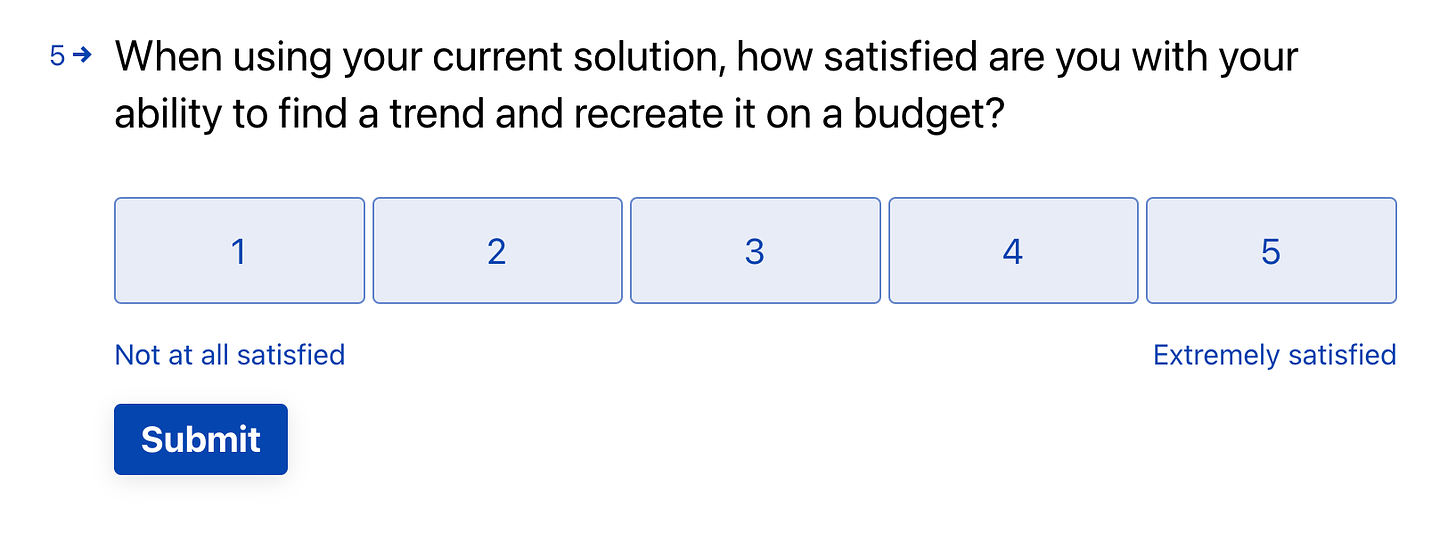
We ended up deciding on ten insights that we felt would have the biggest reach and impact for that segment. I turned those insights into survey questions:
We sent the survey via qualtrics. Luckily, we had a really large panel and had the budget to use our platform to recruit even more of our particular segment. We ended up with 500 responses to the survey, which was right around where we were targeting (we had a significantly large target population).
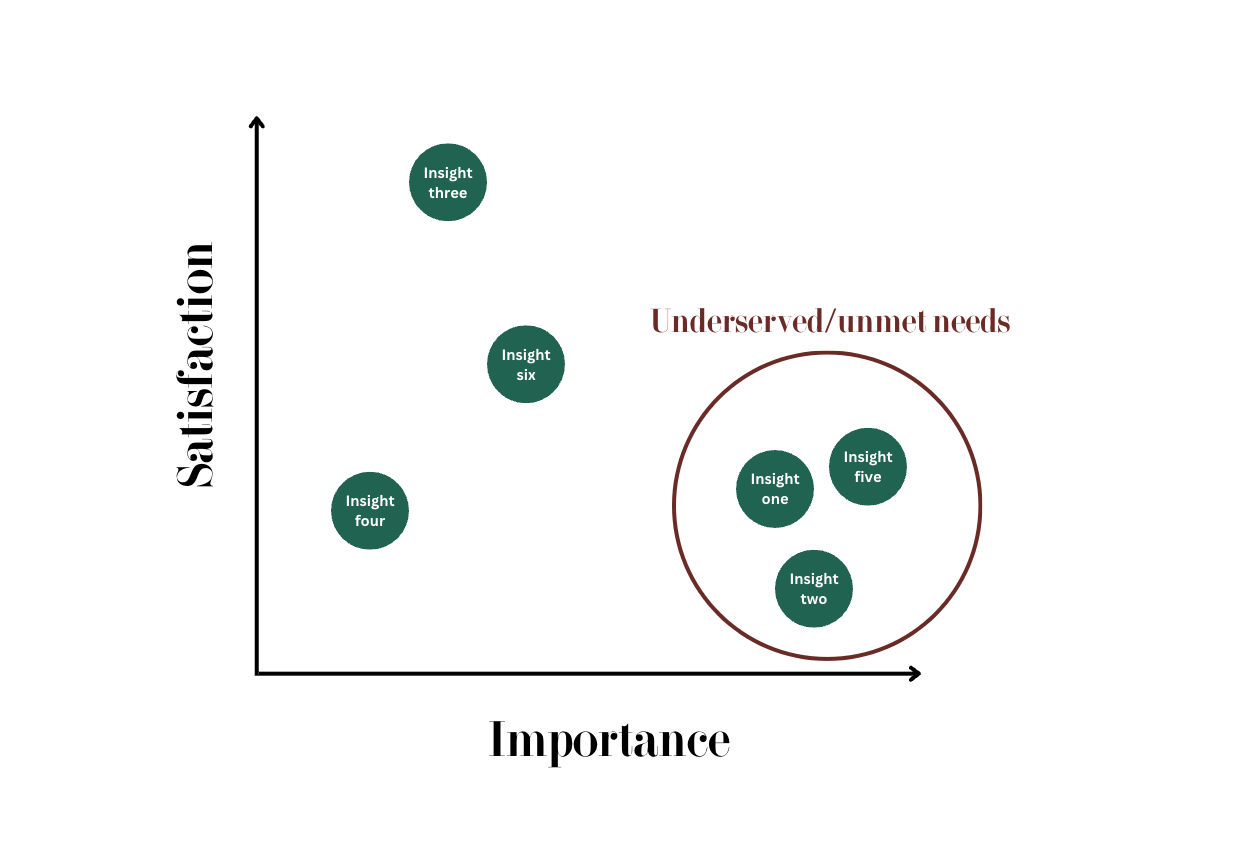
I then scored the different insights and plotted their scores on a graph:
The insights that had a high average level of importance and a low average level of satisfaction are those we decided to focus on right away.
We sent out two subsequent phases of the survey to include the other twenty insights we’d found and added to the graph and continued to reprioritize if we found another underserved insight or unmet need, based on the opportunity scores.
I shared this graph with my teams to help them visualize the scores and it hugely helped us with taking all that wonderful data and figuring out the best place to start, based on our users’ perceptions rather than our own.
Join my membership!
If you’re looking for even more content, a space to call home (a private community), and live sessions with me to answer all your deepest questions, check out my membership (you get all this content for free within the membership), as it might be a good fit for you!



Such a GREAT article. Thank you SO SO much Nikki!
If I had heard about the Opportunity Gap survey earlier, I would have definitely saved a ton of time!